Nathan Yearous
Information Science | Data Enthusiast| Boulder, CO 80302 | 720-450-7362 | [email protected] |
I am a motivated and energetic individual with a strong drive to use data to tell stories, solve problems, and build meaningful tools. By combining my technical skill set with a background in sports and media, I create insights that connect with real people. Ultimately, my goal is to find a career pathway that blends these two passions!🛠 Skills & ToolsProgramming & Data: Python, SQL, JavaScript, AltairDevelopment: React, FastAPI, SQLAlchemy, Full-stack web applicationsDashboards and Websites: Tableau, Power BI, HTML, ShinyOther Strengths: Problem-solving, communication, teamwork, adaptability
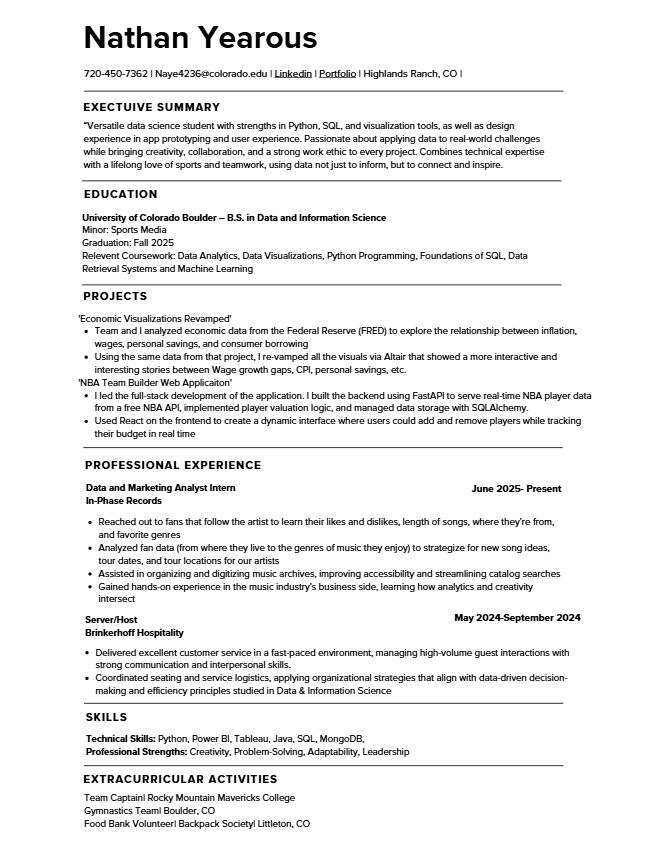
RESUME
MY PROJECTS
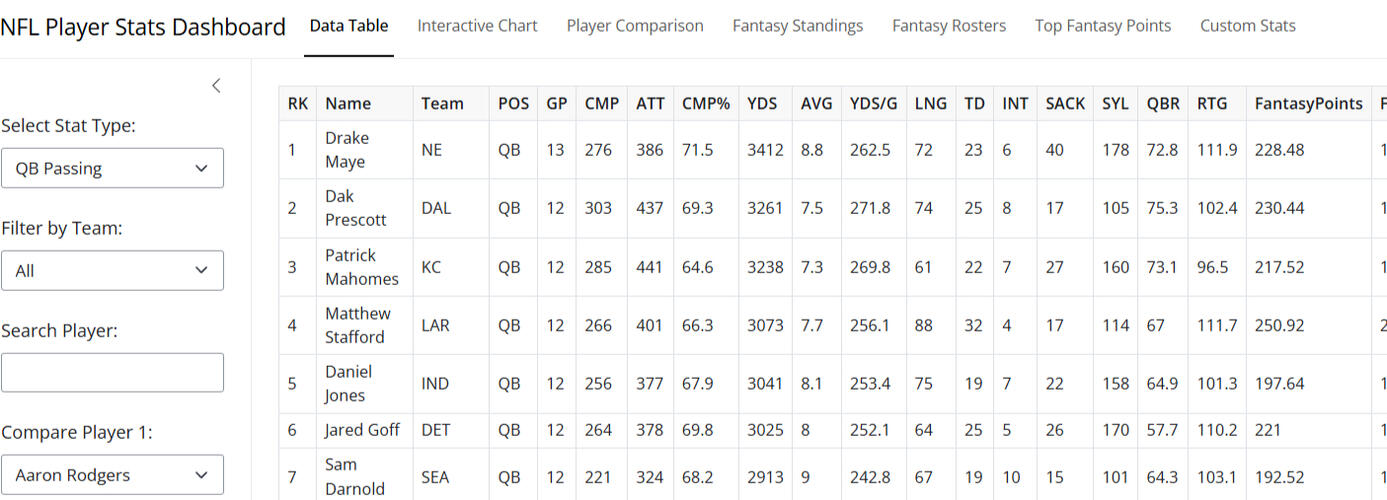
NFL Fantasy Football DashboardPublished: December 2025I built an interactive NFL analytics dashboard that allows users to explore player performance, compare athletes, and analyze fantasy football value across multiple positions. The dashboard integrates real NFL player statistics from ESPN and fantasy league data to create a tool designed for fans, analysts, and fantasy players.🛠 Tools & Technologies
Python
Shiny for Python (reactive web app framework)
Pandas (data cleaning & transformation)
Matplotlib + mplcursors (interactive visualizations)
REST-style CSV data ingestion via GitHub-hosted datasets
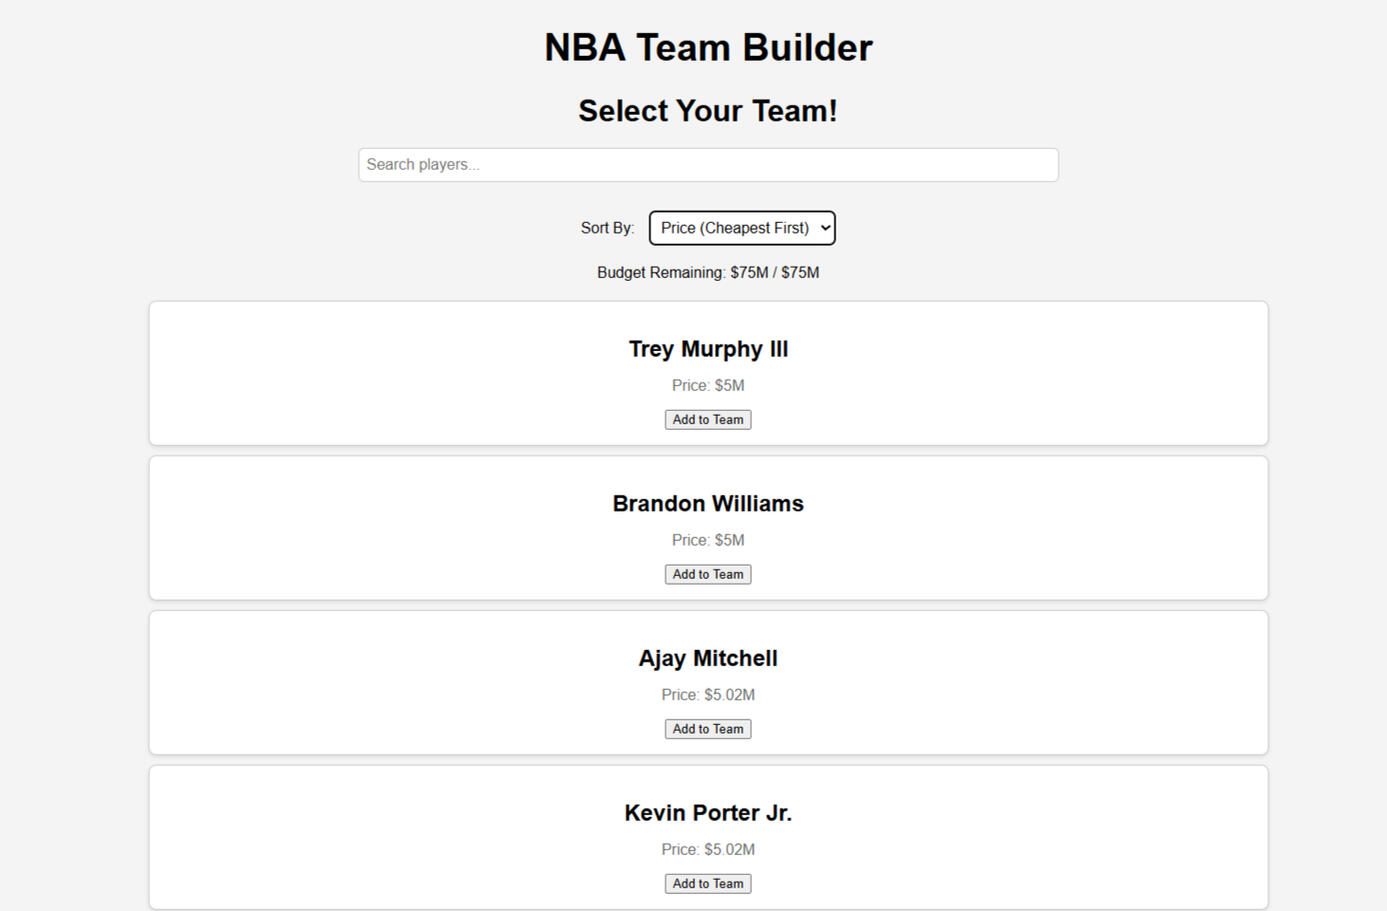
NBA Team Builder Web App
Spring 2025 | Final Project – CU BoulderGoal:
To create an interactive web application that lets users build the best NBA team possible within a set salary cap, using real player statistics and salary data.Work/Tasks:
I led the full-stack development of the application. I built the backend using FastAPI to serve real-time NBA player data from the nba_api, implemented player valuation logic, and managed data storage with SQLAlchemy. On the frontend, I used React to create a dynamic interface where users could add and remove players while tracking their budget in real time.Skills Gained:
Full-stack web development, REST API integration, React state management, database querying with SQL, and practical use of Python in data-driven applications.
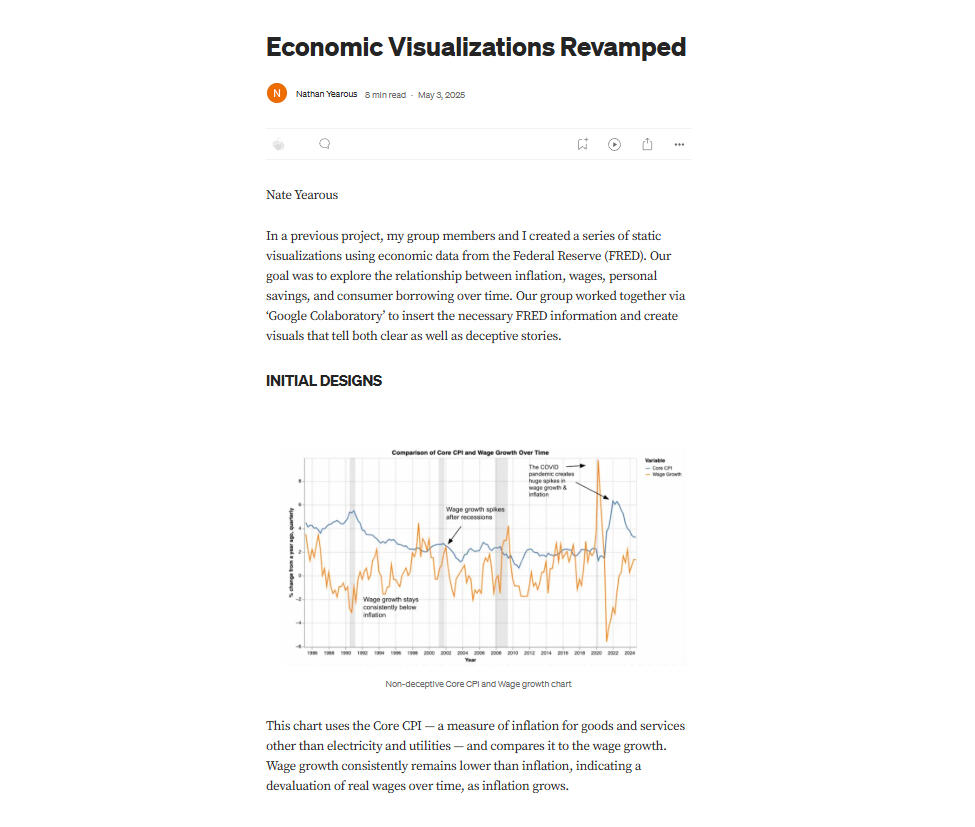
Economic Visualizations RevampedSpring 2025 | Data VisualizationsGoal: Explore the relationship between inflation, wages, personal savings, and consumer borrowing using Federal Reserve (FRED) data, and present it in a more engaging way.Work/Tasks: Analyzed raw economic indicators, identified key narratives around wage growth gaps, CPI, and savings trends, and redesigned all visuals using Altair to create interactive, user-friendly graphics.Skills Gained: Economic data analysis, Python (Altair), interactive data visualization, storytelling with data.
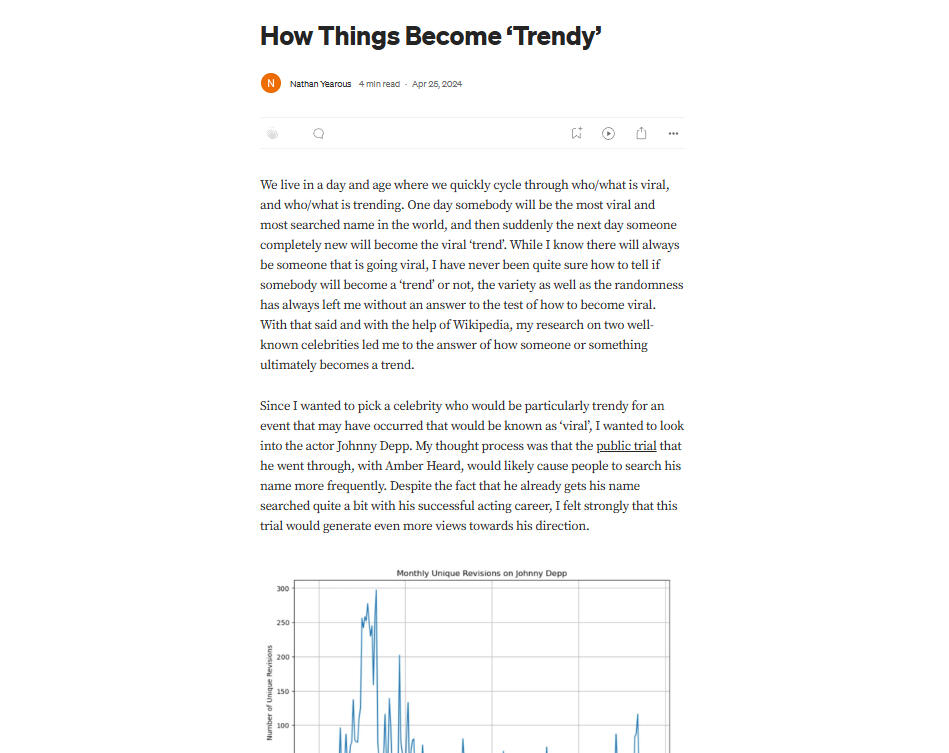
How Actions Become TrendyInformation Exploration | Fall 2024Goal: Investigate how public interest surges around celebrities or events and identify patterns behind what makes something or someone go viral.Work/Tasks:Researched search frequency data (via Wikipedia pageviews) for Johnny Depp and Amber Heard.Analyzed spikes in attention, especially around the 2022 trial, and compared them with career-related peaks (such as Depp's Pirates of the Caribbean in 2007–08).Explored the psychology of virality, highlighting how scandal and failure create way more attention than positive success.Skills Gained: Data-driven cultural analysis, working with web-based datasets, trend interpretation, critical thinking about media and virality.
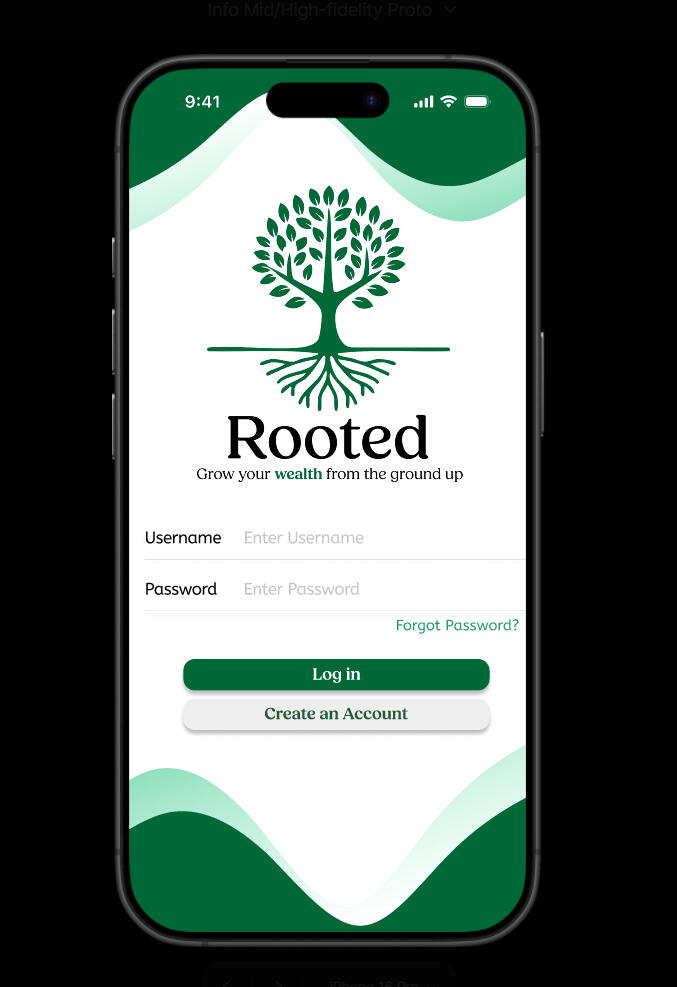
Rooted – App Prototype for Savings and Budget ControlGoal: Design an app prototype for young adults to manage savings and budgets while also providing practical financial education.Work/Tasks: Collaborated with a small team to design a high-fidelity prototype in Figma. Built features such as goal setting, short video content with personalized financial tips, and interactive savings tools to help users learn while managing money.Skills Gained: UI/UX design, Figma prototyping, teamwork, design thinking, financial literacy education.